DSWM Quarterly: Q2 2025
Investing Insights
At the midpoint of 2025, everyday seems to come with its own 4th of July fireworks display. The first week of the second quarter certainly started with some fireworks, not only for the U.S. market but for the entire the world when the new administration announced a sweeping new U.S. tariff policy. The proposed trading policies rattled markets as investors struggled to assess the potential impact on global trade dynamics. The markets quickly began to take a more positive tone as tariffs were delayed or reduced throughout the month of April. Although even at reduced levels, the average effective tariff rate in the U.S. is the highest level since the 1930’s, nonetheless the market maintained an optimistic tone through the remainder of the second quarter. The Federal Reserve has justified a wait and see approach to rate cuts pointing to strong U.S. economic data and uncertainty with regards to the pressures tariffs may have on inflation. The wait and see approach is contrary to the views expressed by the administration, with many comments from the White House pushing for interest rate cuts to spur economic activity that are justified by the fact that inflation has been successfully reigned in. The competing motivations have proven to spark market volatility and should be expected to continue to do so throughout the second half of the year. 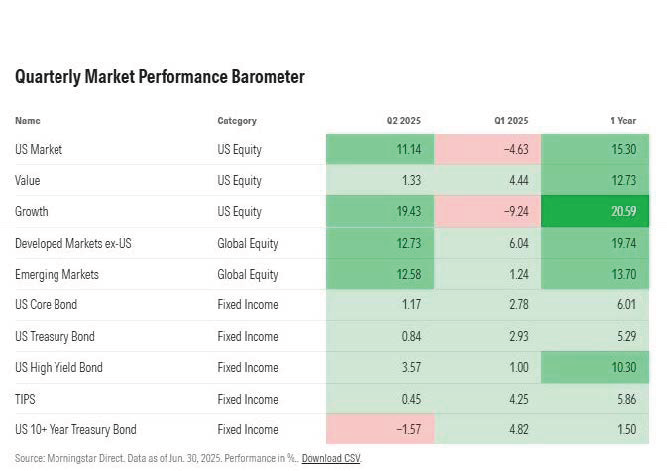
The U.S. stock market delivered the best quarter since the fourth quarter of 2023. The start of the second quarter was not pretty: following the administration’s announcement of a global tariff policy, both U.S. large and small cap stocks sold off to each finish the first week in April down over 10%. By the end of April, U.S. stocks had recovered those losses as many of the tariffs announced at the start of April were either reduced or paused for 90 days. After being the first quarter’s biggest laggard, the technology sector resumed being the main driver of U.S. large cap equity returns during the second quarter. While the dynamic nature of the U.S. trade policy is still a concern for all U.S. equities, many investors seem to have taken the view that the large technology companies are more resilient to the ever-changing trade policy, as demonstrated by their outperformance during May and June. This outperformance propelled growth stocks to dramatically outpace value stocks for the quarter. U.S. small cap stocks also rebounded during the second quarter, albeit not to the magnitude of U.S. large caps. By the end of the quarter, the S&P 500® finished up by over 10%.
The bond market was turbulent at times throughout the quarter, primarily during the aftermath of the tariff announcements in early April and the outbreak of the Israel-Iran conflict in June. Throughout the quarter, the bond market was also heavily influenced by the fiscal deficit in the U.S. and the impact that policy discussions in Washington could have on adding to the deficit. As the passage of the “One Big Beautiful Bill Act” became more likely, long term U.S. treasury yields rose. Many analysts believe that the market demanding more yield from longer U.S. treasuries is an early signal that the budget deficit in the U.S. could begin to weigh more heavily on its creditworthiness. Despite some periods of volatility, global and U.S. bond markets proved resilient for the quarter and finished in positive territory.
International equities built on momentum from the first quarter and posted another great quarter, with some markets even outpacing U.S. equities for the quarter. While companies outside the U.S. did perform well for the quarter, the main contributor to returns were currency exchange rates. The U.S. dollar weakened substantially over the quarter, as uncertainty surrounding trade with the U.S. and budget deficits caused some holders of U.S. dollars to diversify into other major developed currencies. The depreciation of the U.S. dollar was a particularly strong tailwind for emerging market and Asian market returns.
The remainder of the year points to continued periods of volatility. This chart from Morningstar displays the standard deviation present in various markets across different time frames. Standard deviation is one way to measure volatility; in the case of this chart it shows how spread out (or volatile) the prices of the stocks or bonds that make up each of the listed market indices were during those time periods. The first quick observation is the upward trend in the volatility of U.S., International, and Emerging Market equities from Q4 2024 to Q2 2025. The second observation is just how elevated volatility was during this past quarter when compared to the 5-year average, for U.S. equities that level was nearly doubled. The last observation, and a powerful one for portfolio construction, is the steadiness bonds exhibited across each period. This chart is a visual of why we hold assets like bonds, structured notes, and money markets; they act as insulation for our portfolios during periods of short-term volatility.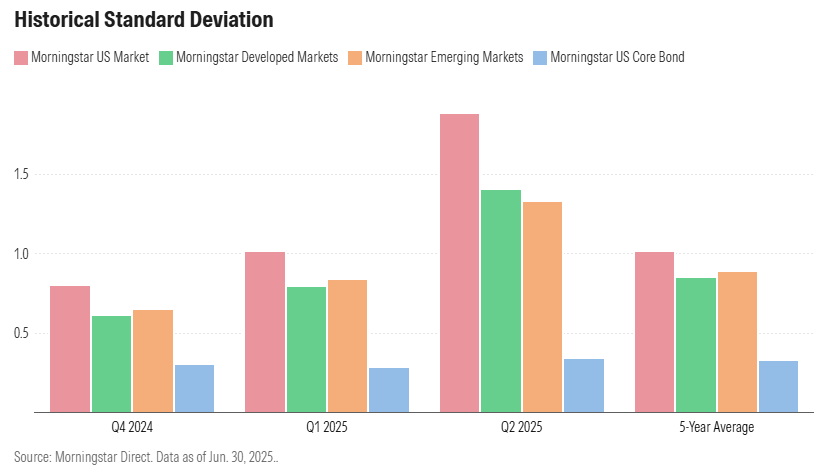
Although the 4th of July is behind us, expectations are that fireworks will persist in the headlines. At times, it might seem like we are watching a never-ending fireworks display. This might sound intimidating or frustrating, but long-term investing is managing through never-ending fireworks at times, and it requires monitoring, planning, and patience. Where frustration can really start to present itself is by taking a short-term investment approach. Looking for an upcoming headline or market move to present the perfect time to enter or exit the market is not only impossible to do consistently, it very well could blow up in your face (we couldn’t help but use this last fireworks analogy). With that said, whatever the second half of the year brings to the markets, please take comfort knowing everyone here at Droms Strauss is working to keep your portfolio on its long-term path through it all.
Droms Strauss Wealth Management
www.droms-strauss.com
(314) 862-9100
For information purposes only. Opinions expressed herein are solely those of Droms Strauss Wealth Management, unless otherwise specifically cited. Material presented is believed to be from reliable sources, but no representations are made by our firm as to another parties' informational accuracy or completeness. All information or ideas provided should be discussed in detail with an advisor, accountant, or legal counsel prior to implementation. Past performance may not be indicative of future results. Indexes are not available for direct investment. Any investor who attempts to mimic the performance of an index would incur fees and expenses which would reduce returns.